| StockFetcher Forums · General Discussion · Weekly chart to match Daily chart | << 1 2 >>Post Follow-up |
| snappyfrog 751 posts msg #160816 - Ignore snappyfrog modified |
1/30/2024 10:32:06 PM I use the following for finding a 5 day low. Scan finds the 5 day low 2 days ago and 1 day ago the low is higher than the 5 day low. Now I want to do the same thing on a weekly chart, but nothing is working correctly. I want the 5 week low 2 weeks ago and then last week to have a higher low. Here is the daily scan setup: The weekly chart doesn't give me the same setup: |
| snappyfrog 751 posts msg #160818 - Ignore snappyfrog |
1/31/2024 7:35:08 AM I left out a couple "weekly" in the scan, so that may have been the problem. Some charts still don't look just right, so I will keep checking. |
| xarlor 642 posts msg #160820 - Ignore xarlor |
1/31/2024 10:06:24 AM You found 2 of 3 weekly. Put in the third one and it works as you expect. Trying to make weekly scans work right is like hunting shadows in the dark. |
| snappyfrog 751 posts msg #160822 - Ignore snappyfrog |
1/31/2024 4:45:47 PM @xarlor That is so much better!! Thank you. |
| snappyfrog 751 posts msg #160824 - Ignore snappyfrog |
1/31/2024 10:18:35 PM Many of the charts look right, but still getting some like this one where it is showing the chart several weeks late. Back to the drawing board. 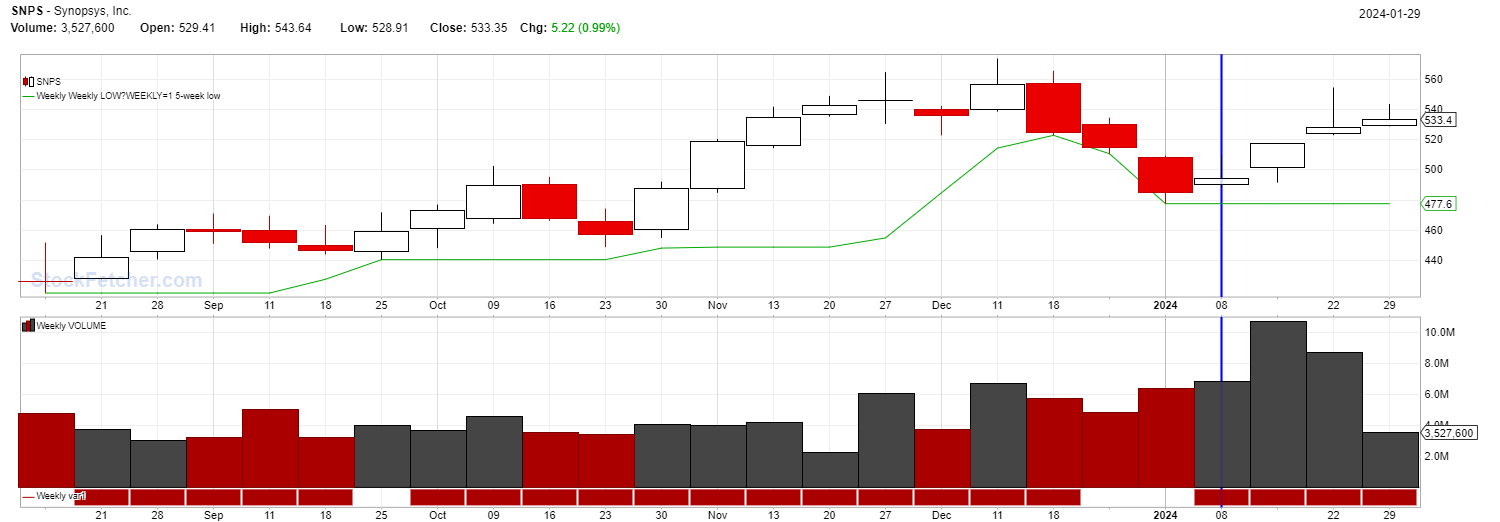 |
| nibor100 1,103 posts msg #160826 - Ignore nibor100 |
2/1/2024 2:55:41 AM I’m not quite following, what part of that chart is late? Thanks Ed S |
| snappyfrog 751 posts msg #160827 - Ignore snappyfrog modified |
2/1/2024 6:21:04 AM These lines: set{var1, count (weekly low above weekly low 5 week low,1)} draw var1 > .99 and var1 1 week ago < .99 should pull up a chart when it has the first red / blue rectangle under the chart. I included the vertical blue line when this stock should have been picked. In the example above, it was 3 - 4 weeks prior that the rectangle shows up. |
| snappyfrog 751 posts msg #160828 - Ignore snappyfrog |
2/1/2024 6:57:59 AM Maybe I am not explaining it well enough. In my first post above, the 5 day low scan pulls up stocks when the low is greater than the 5 day low and the previous day was the 5 day low. I now can look at pre-market to only get into the trades that will open above the close on the charts shown in the scan. I am trying to do that on weekly charts now to find longer swing trades. So in the example chart below. I want to run this on the weekends. I need last week to be a higher low than the previous week. That previous week needs to be making a new low. In pre-market on Monday I can only look for those where open Monday will be above the close of Friday. So I need the chart to show on the scan when the weekly low is higher after a weekly downtrend. Maybe this would just be easier trying to do it with daily charts? 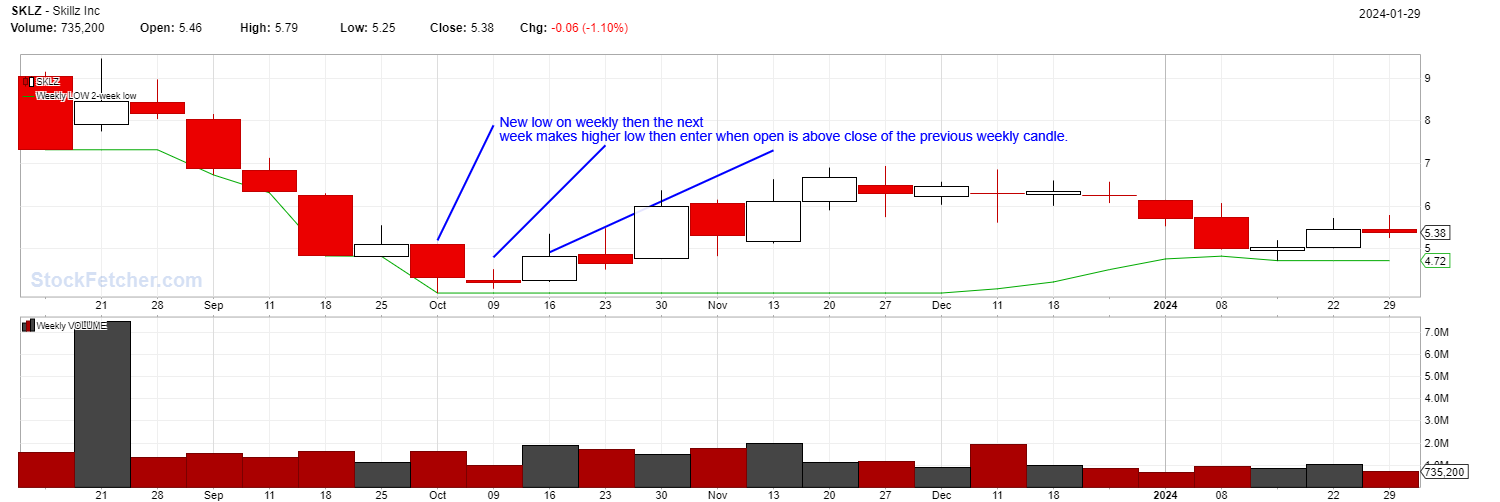 |
| xarlor 642 posts msg #160829 - Ignore xarlor modified |
2/1/2024 8:40:18 AM In that case, I would have written it like this: |
| snappyfrog 751 posts msg #160837 - Ignore snappyfrog |
2/1/2024 5:10:26 PM That's looking better, but still getting some like this where the low is below low 1 week ago. This chart is from Monday as it needs to be run on the weekend. 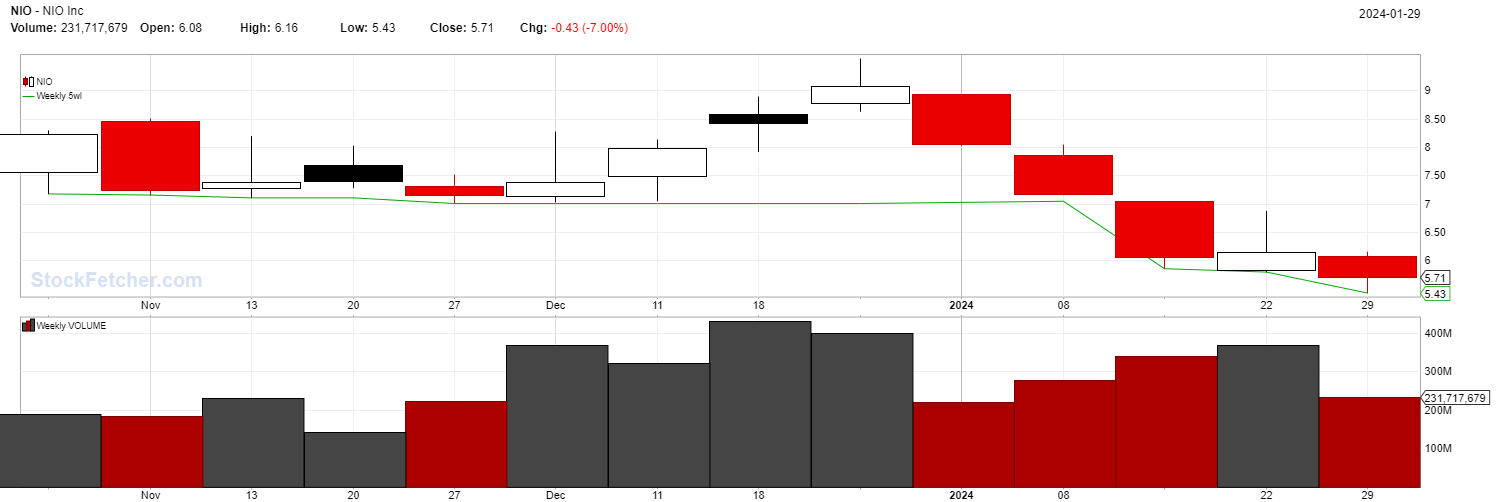 |
| StockFetcher Forums · General Discussion · Weekly chart to match Daily chart | << 1 2 >>Post Follow-up |