| StockFetcher Forums · General Discussion · Stan Weinstein's Secrets For Profiting in Bull and Bear Markets | << 1 ... 2 3 4 5 6 ... 11 >>Post Follow-up |
| Mactheriverrat 3,178 posts msg #148398 - Ignore Mactheriverrat modified |
7/6/2019 2:40:49 AM @volvloe Submit |
| davesaint86 726 posts msg #148409 - Ignore davesaint86 |
7/7/2019 12:10:50 AM code from TradingView //@version=3 // Use this indicator to compare how security is performing in compare with prefered index (SPX by default). // > 0 outperforming // < 0 underperforming // Works best for weekly, but can be applied to monthly and daily charts. It will be rather useless to use it in smaller timeframes // Apply it to SPX, industry index, sector index or other security in similar sector // UPDATE 1: Added sector and industry as optional params. Leave them same as index if you don't want to use them study("Mansfield Relative Strength indicator") index = input(title="Index", type=symbol, defval="SP:SPX") sector = input(title="Sector (optional)", type=symbol, defval="SP:SPX") industry = input(title="Industry (optional)", type=symbol, defval="SP:SPX") ma_type = input(title="Which moving average to use?", defval="SMA", options=["SMA", "WMA", "EMA"]) len_daily = input(title="MA length for Daily", defval=200) len_weekly = input(title="MA length for Weekly", defval=52) len_monthly = input(title="MA length for Monthly", defval=10) len_other = input(title="MA length for all other periods", defval=52) val = close len = period == "W" ? len_weekly : (period == "D" ? len_daily : (period == "M" ? len_monthly : len_other)) ma_func(x, length) => ma_type == "WMA" ? wma(x, length) : (ma_type == "SMA" ? sma(x, length) : ema(x, length)) calc_mrs_func(x, ind, length) => ((x / security(ind, period, x)) / ma_func((x / security(ind, period, x)), length) - 1) * 10 mrs_index = calc_mrs_func(val, index, len) mrs_sector = calc_mrs_func(val, sector, len) mrs_industry = calc_mrs_func(val, industry, len) c = sign(mrs_index) + sign(mrs_sector) + sign(mrs_industry) bgcolor(c == 3 ? color(green, 80) : c == 2 ? color(green, 75) : c == 1 ? color(green, 70) : c == -1 ? color(red, 70) : c == -2 ? color(red, 75) : c == -3 ? color(red, 80) : gray) plot(mrs_index, linewidth=3, title="MRS index") plot(mrs_sector != mrs_index ? mrs_sector : na, linewidth=2, title="MRS sector") plot(mrs_industry != mrs_index ? mrs_industry : na, linewidth=1, title="MRS industry") hline(price=0, linestyle=dashed, title="Zero baseline") |
| davesaint86 726 posts msg #148413 - Ignore davesaint86 |
7/7/2019 11:33:49 AM https://www.tradingview.com/x/MwjLOJFP/ https://www.tradingview.com/x/7S4tx1oq/ |
| Mactheriverrat 3,178 posts msg #148505 - Ignore Mactheriverrat modified |
7/13/2019 8:45:00 PM Submit You should see charts like this  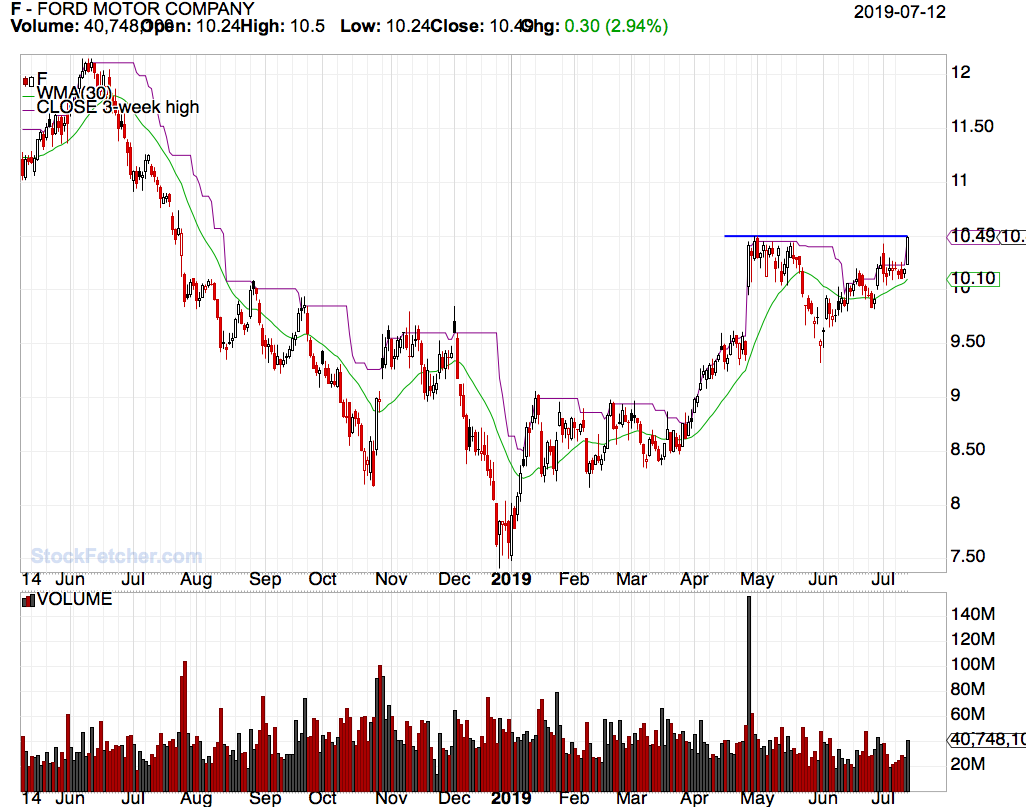 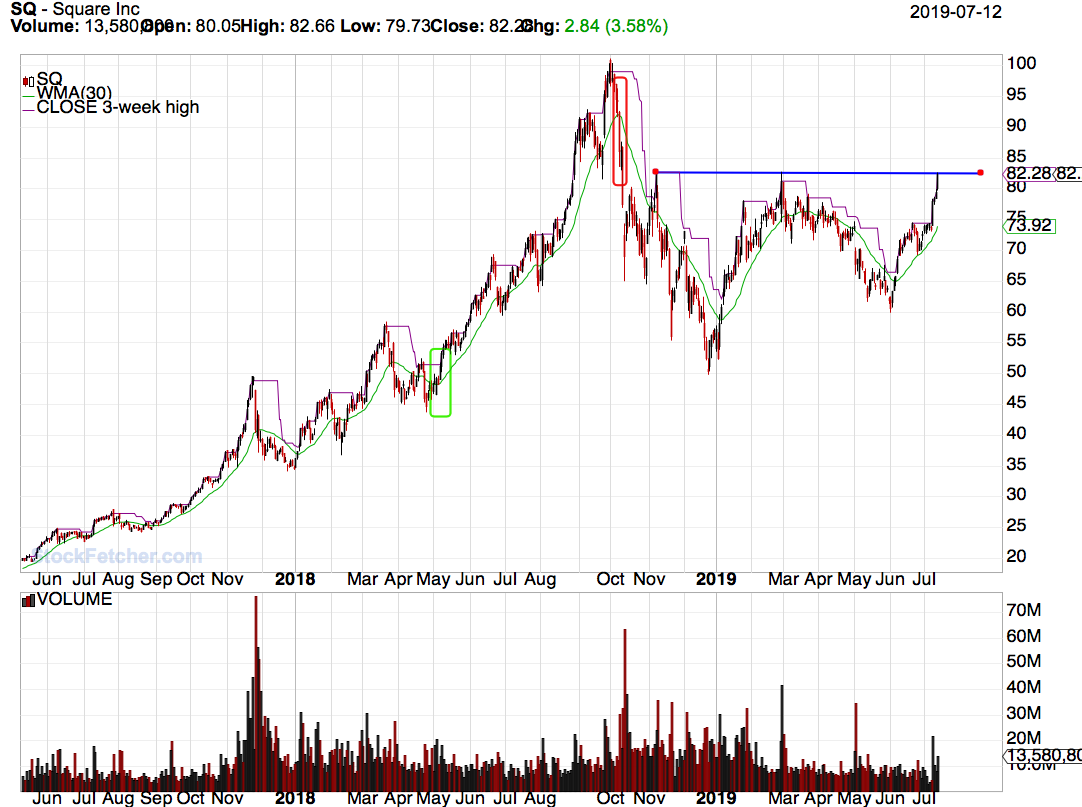 |
| davesaint86 726 posts msg #148506 - Ignore davesaint86 modified |
7/13/2019 9:30:19 PM I found the Weinstein filter on ChartMill and here is their current list. Many of these stocks are still in stage 2. |
| Mactheriverrat 3,178 posts msg #148507 - Ignore Mactheriverrat |
7/13/2019 9:40:28 PM @davesaint86 Chartmill is another great site. Kudo's on your filter. I like Weinstein's way of finding trends on the weekly charts. |
| volvlov 32 posts msg #148508 - Ignore volvlov |
7/13/2019 9:44:37 PM I am going to watch this one closely next week. 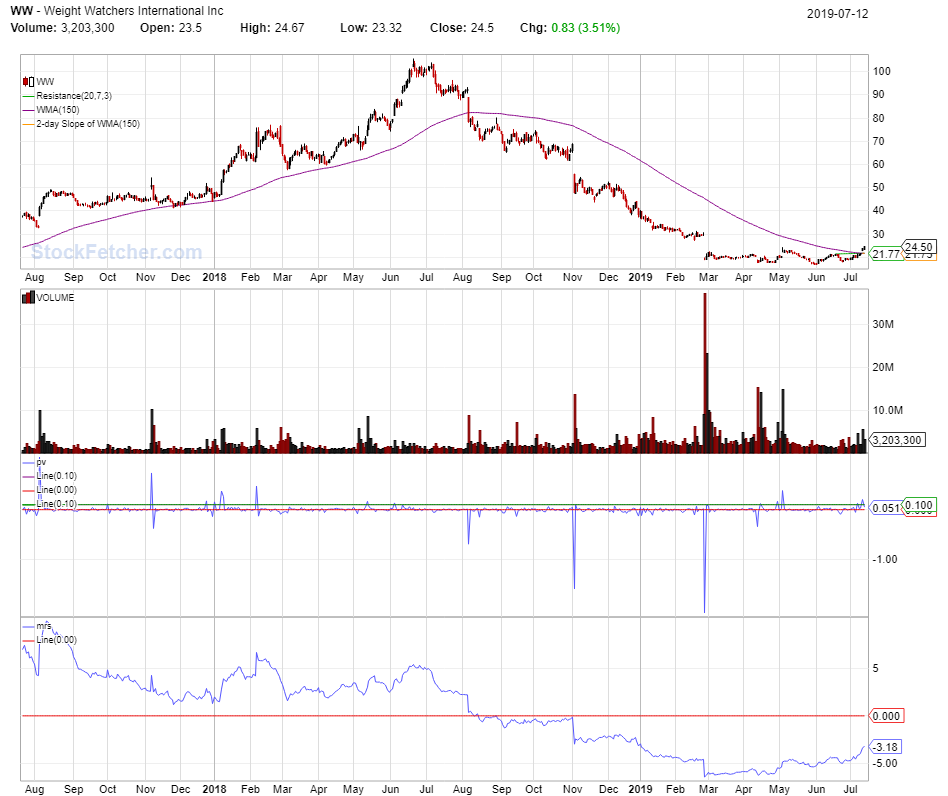 |
| Mactheriverrat 3,178 posts msg #148509 - Ignore Mactheriverrat |
7/13/2019 10:00:21 PM WW has a history of being explosive past on a weekly basis. |
| lemmy 13 posts msg #148510 - Ignore lemmy |
7/14/2019 9:16:59 AM Stan Weinstein's book was the first book I'd ever bought about trading and/or technical analysis, and it is still my favorite. I consider it a "must have" in one's trading library. |
| ron22 255 posts msg #148512 - Ignore ron22 |
7/14/2019 11:14:36 AM davesaint86, Chartmill is a great site. I just joined. Your filter gives 96 matches. How do you narrow it down to 10-20 for a watchlist? Also, what do you use for entry and exit triggers? Thank you for your input. |
| StockFetcher Forums · General Discussion · Stan Weinstein's Secrets For Profiting in Bull and Bear Markets | << 1 ... 2 3 4 5 6 ... 11 >>Post Follow-up |