| StockFetcher Forums · General Discussion · Sector ETFs in one indicator | << >>Post Follow-up |
| snappyfrog 751 posts msg #161128 - Ignore snappyfrog |
6/8/2024 10:01:28 AM Is there a way I can take the following sector ETFs, do some type of "count" if they are up or down and combine them all into an oscillator with a zero line? Basically, if 6 or more are up, the oscillator would be above 0 and if 6 or more are down it would be below 0. Or is there a better way of figuring out a market depth indicator? I presently am using the McClellan with a 5 day smoothing, which I love. xlk,xlv,xlf,xlre,xle,xlb,xly,xli,xlu,xlp,xlc McClellan Oscillator that I presently use: |
| nibor100 1,103 posts msg #161129 - Ignore nibor100 |
6/8/2024 5:41:13 PM I believe this gets you close to what you wanted....plus, once again, I learned a little more about SF, summing a limited column of variables from different stocks! Ed S. |
| snappyfrog 751 posts msg #161132 - Ignore snappyfrog |
6/8/2024 6:12:00 PM Very nice Ed. I remember another post you did sums that way. Very cool. Thanks! |
| snappyfrog 751 posts msg #161133 - Ignore snappyfrog modified |
6/8/2024 6:31:21 PM I have put it only on SPY so I can see the sum of all of the sectors against the overall market chart. I also only kept the smoothed Snappy to reduce the noise and made it a slower cma(Snappy,10). I think I am getting there. This chart shows when the Snappy,10 crossed below 6 with the corresponding move on Spy. The next set of vertical lines shows when the sectors (Snappy,10) was 6 or above and the move on SPY. I am hoping to see advanced weakness against the SPY chart as a warning when to be ready to bail on bullish moves (see the peak on Snappy,10 just left of the right hand vertical line). 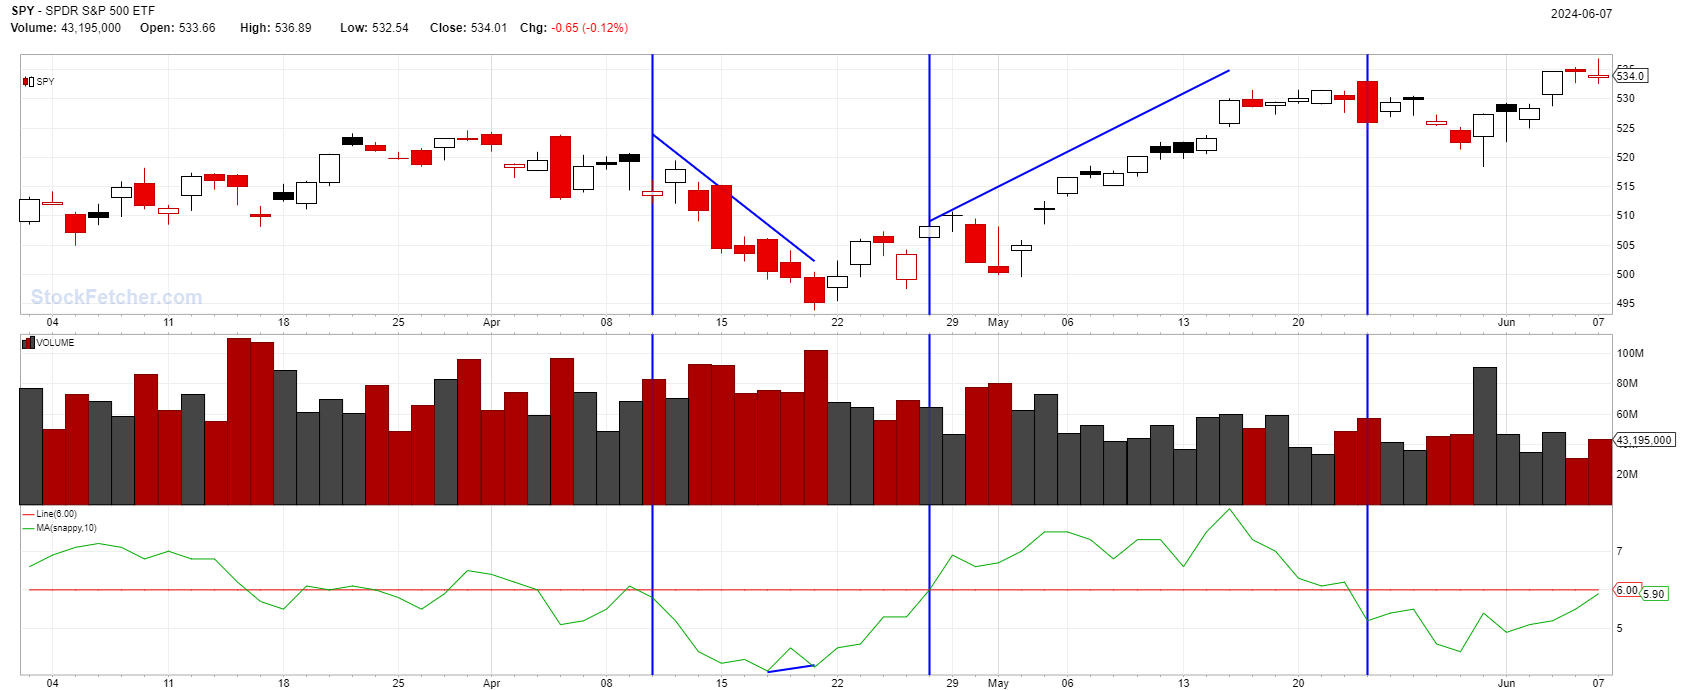 If you have a basic subscription, you may have to click the Fetch button twice. |
| snappyfrog 751 posts msg #161136 - Ignore snappyfrog |
6/9/2024 6:35:42 AM After playing with the settings, I think I like Snappy(5) best. It seems to be a good balance between noise and a more accurate picture of what the relationship is between the sectors and overall market. Basic subscribers may have to hit Fetch twice to see the chart. |
| styliten 345 posts msg #161137 - Ignore styliten |
6/9/2024 10:21:35 AM Wow, that’s a very clever use of IND combined with a custom function. Now it seems possible to track the largest 25 tickers of the US stock market, approximately 36% of the entire market cap is in these 25 tickers! (The next 25 tickers has 8.6% of the stock market and the next 25 tickers some 6%. So literally these 75 tickers [out of ? 6000+ total] are half of the entire US stock market in terms of market cap. The largest companies are getting ever bigger share of the pie daily squeezing out everyone else.) |
| nibor100 1,103 posts msg #161138 - Ignore nibor100 |
6/9/2024 10:57:55 AM @styliten, Does that mean you were able to sum 25 symbols IND()s without the filter not executing due to complexity issues? thanks, Ed S. |
| snappyfrog 751 posts msg #161149 - Ignore snappyfrog |
6/14/2024 10:45:14 PM Looking back 2 years using the Snappy,5 and Snappy,10, I have determined that there is nothing for me to see in this as a market breadth indicator. |
| StockFetcher Forums · General Discussion · Sector ETFs in one indicator | << >>Post Follow-up |