| StockFetcher Forums · Filter Exchange · PORTFOLIO SELECTION AND MANAGEMENT USING RISK/REWARD RATIOS | << 1 ... 58 59 60 61 62 ... 65 >>Post Follow-up |
| Toad 20 posts msg #124420 - Ignore Toad modified |
7/19/2015 2:47:18 PM Well, I am stumped...I can't find an error in my study. If anyone would like to take a look at the study, you can download the excel file I created/used for it here: http://www.mediafire.com/view/1z1ngbyn7pjjlqd/Kevin's_Mutual_Funds_Screener_Validation.xlsx I hope there is an error in there somewhere...I can't find one if there is though. I even tried smoothing the selection ranking out by averaging the ranking from the reallocation day as well as the previous 3 days...this helped to reduce the standard deviation some for the 4 fund variation but didn't change the two fund variation much. For anyone who decides to look for themselves, the optimization results are summarized around cell AJ1054 in all sheets. The raw close data (obtained from yahoo finance) is in the first columns (B-E), and the various "look back" periods are in the columns next to the close data (G-Z). Note that I manually modified some of these for IWM and EFA to account for the splits those funds had. The manually modified cells are highlighted in green. IWM had a 2 for 1 split on 6-9-05 and EFA had a 3 for 1 split on 6-9-05. Ranking formulas are the next set of columns (around AC), and the fund selection screen and resulting return for the following 21 days for each possible start is shown in the following set of columns...I have shown the fund that should be selected, the period return from the following day to 21 days forward, and the cumulative return (really account size not return). The first sheet is the SPY-IWM-EFA-AGG, the second sheet is the SPY-AGG, the third sheet is the SPY-IWM-EFA-AGG smoothed, and the fourth sheet is the SPY-AGG smoothed. I didn't spend much time trying to optimize the smoothed ones since at that point it seemed to me this strategy was a lost cause. If anyone takes a look at this and sees an error please let me/everyone know...until then I remain unconvinced that this strategy has merit which is odd considering there seems to be a good number of people using it. Believe me, I want this strategy to have merit and there to be an error in my study but I just don't see it...perhaps I am misunderstanding the basis for the screen but it really is quite simple so I don't think that is it. If for some reason someone is unable to obtain the file I have uploaded, please let me know...I am not sure if mediafire has a time limit on uploads. |
| tennisplayer2 210 posts msg #124473 - Ignore tennisplayer2 modified |
7/21/2015 11:47:51 PM I can't seem to be able to open the file, but I do like Tactical Asset Allocation. I also know the Kevin backtests extensively before he posts. Toad, I hope that you are incorrect. Thanks for you input. |
| Toad 20 posts msg #124477 - Ignore Toad |
7/22/2015 9:01:04 AM Tennisplayer (I am also a tennisplayer yay :P). Did you try downloading the file and opening it or just try to let it open in the browser. It is a large file (~10 MB) since it has a lot of raw data in it so it probably won't open in the browser. What version of excel do you have? I will save it down to 2003 format and reupload it tonight...maybe that is the problem. |
| tennisplayer2 210 posts msg #124480 - Ignore tennisplayer2 |
7/22/2015 10:02:02 AM Toad, glad to hear that you are also a tennisplayer. I was able to download it and then open it. Lots of data to analysis. I am surprise that the returns are not that impressive. I hope that Kevin will chime in. Thanks. |
| Toad 20 posts msg #124484 - Ignore Toad |
7/22/2015 8:03:58 PM Good that you were able to open it...just tried to save it down and it looks like I used a formula function throughout =index(match()) that was not available in the older versions...short story is I can't really save it down and keep the formulas intact. I may look through this again this weekend since I do need a good 401k management strategy, but I really do not think I have made an error in my backtesting. |
| Kevin_in_GA 4,599 posts msg #124485 - Ignore Kevin_in_GA |
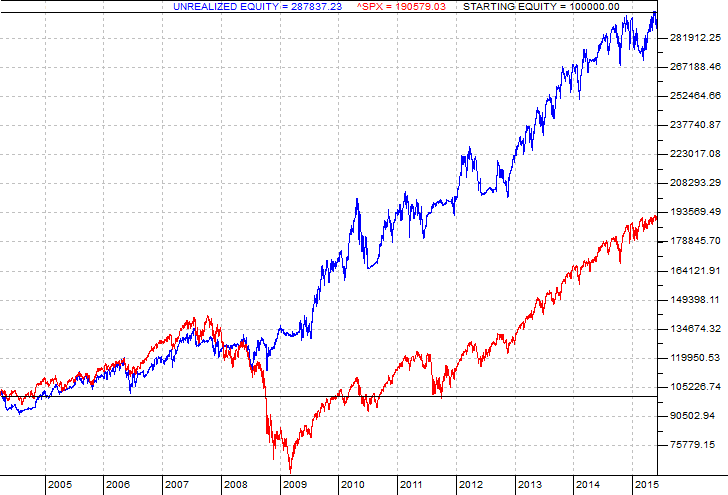
7/22/2015 9:49:09 PM Toad: not really sure how you are backtesting this - I simply use the end of each month and make a re-allocation at the open of the next trading day. Here are the StrataSearch backtest results for the same period as you have backtested: EQUITY CURVE: 
STATS: 
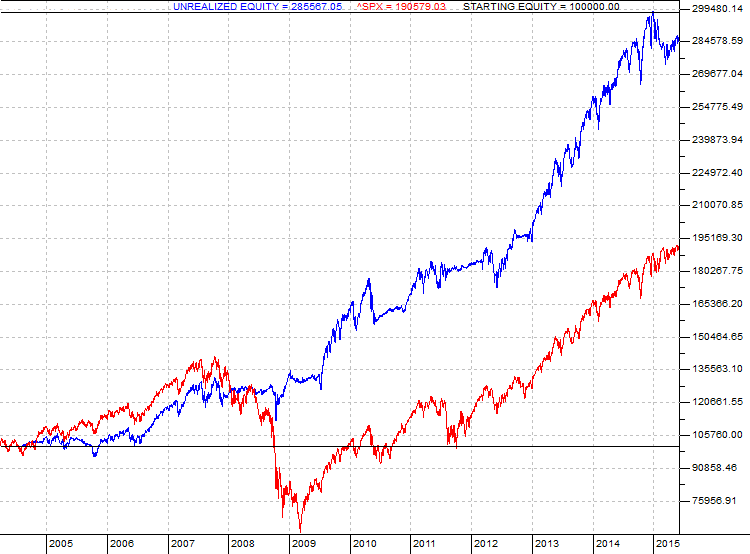
The more simplistic SPY-AGG system gives basically the same results: EQUITY CURVE: 
STATS: 
This is consistent with what I have been seeing - it beats the market with lower drawdown and consequently a higher Sharpe ratio. Trade it or not as you see fit. |
| Toad 20 posts msg #124487 - Ignore Toad |
7/23/2015 12:02:03 AM It is probably me trying to over-complicate my spreadsheet...I will look into my sheet this weekend. Thanks for providing me with the stratasearch graph for the period I used...should be helpful to find where I am going wrong. |
| mahkoh 1,065 posts msg #124488 - Ignore mahkoh |
7/23/2015 6:54:44 AM Toad, One thing that seriously affects your results is using non adjusted close prices. You should check the results when using adjusted prices as Stratasearch does. |
| Toad 20 posts msg #124489 - Ignore Toad |
7/23/2015 8:33:56 AM I will look at that mahkoh, thanks. I have been using non-adjusted close prices, but can swich them for the adjusted easily. I would imagine that does make a difference especially with AGG. |
| mahkoh 1,065 posts msg #124496 - Ignore mahkoh |
7/23/2015 5:38:41 PM Examining the equity curves above I notice that holding SPY actually outperforms the system until mid 2007. And note that buy and hold nearly doubles after touching breakeven in late 2011 while rotating adds some 50 % during the same period. It would seem the system mainly has an edge during times of market turmoil. |
| StockFetcher Forums · Filter Exchange · PORTFOLIO SELECTION AND MANAGEMENT USING RISK/REWARD RATIOS | << 1 ... 58 59 60 61 62 ... 65 >>Post Follow-up |